OGD implementation: data availability
Effective open government data initiatives should provide access to a wide range of data. Although there have been small gains in the availability of open data this year, all too often governments are still publishing only selected datasets, with limited data published on important areas such as public sector performance and expenditure. In addition, the widespread lack of timely data is a major barrier to wider open data use.
The implementation component of the Barometer looks at the extent to which accessible, timely, and open data is published by each country government. The 15 kinds of data included in our survey reflect a wide range of functions of government, and the kinds of uses to which data can be applied. Although noting that the categories are not mutually exclusive, we have divided datasets into three groups, in order to look at the extent to which open data initiatives are resulting in the datasets required to support a wide range of possible outcomes and benefits.
| Innovation | Social Policy | Accountability |
|---|---|---|
| Data commonly used in open data applications by entrepreneurs, or with significant value to enterprise. | Data useful in planning, delivering and critiquing social policies & with the potential to support greater inclusion and empowerment. | Data central to holding governments and corporations to account. Based on the ‘Accountability Stack’. |
| Map Data, Public Transport Timetables, Crime Statistics, International Trade Data, Public contracts | Health Sector Performance, Primary or Secondary Education, Performance Data, National Environment Statistics, Detailed Census Data | Land Ownership Data, Legislation, National Election Results, Detailed Government Budget, Detailed Government Spend, Company Register |
With the exception of trade statistics, all of these data categories are explicitly noted in the technical annex of the G8 Open Data Charter as categories “of high value, both for improving our democracies and encouraging innovative re-use of data”1.
Degrees of openness
We assess the availability and openness of each category of data in each country on the basis of a 10-point checklist. Through a weighted aggregation, this is used to give each dataset a score of 0 - 100. In this edition we introduce a reduction in score of -5 for outdated datasets, to reflect the limited utility of data that should have been updated over the last year, but which has not been2. The chart below shows the average scores for each category across all countries surveyed, and allows a view of the average for countries with an emerging or established Open Government Data initiative3.
The overall trend is generally a positive one, with slight increases in the openness of most datasets, even when the timeliness score reduction that affects many datasets is taken into account. But progress is slow. At the current rate of improvement, it will be decades before the datasets we survey are provided as open data across the world. The difference between openness of data in countries with an open data initiative and those without, while establishing correlation rather than causation, does point toward open data initiatives working to bring about greater supply of open data, and the strength and pace at which initiatives translate into increased data supply invites further investigation. However, as the previous edition of the Barometer noted, a large gap remains between the availability of different categories of data, with a gulf between the high provision of statistical datasets, like the census, and limited provision of important infrastructural and accountability datasets.
Researchers particularly noted the limited scope of education and health performance data in many countries. While basic statistical information is often available through national statistical agencies to qualify against the category definitions used in our survey, the granularity and detail of performance information was very limited. For an effective data revolution that empowers citizens to hold services to account, increased direct flows of open data from line ministries to citizens — rather than solely mediated through statistical agencies — may be required. In some countries, independent agencies, or projects run in partnership with the state, mediated access to high quality health or education statistics, acting as a bridge between data producers and users. However, few of these institutions have yet to embrace open data practices.
The year-to-year drop in the average spending data score can be accounted for, in part, by use of a stricter definition of the category in this edition of the Barometer — where yearly data was previously accepted, this year’s report asked for transaction-level spending, or at least reasonably disaggregated quarterly reports. However, even with this noted, a substantial difference between the publication of budget data and spending data is evident. Governments are much more likely to make available data on plans, rather than on their implementation. This reflects the gap that Andrews has noted, when analysing the Open Budget Index datasets, between ‘Transparency in Formulation’ of policy, and ‘Transparency in Execution’4, and highlights the importance of examining both the technical capabilities of governments to publish information on execution of policy, and the incentive structures and strategic choices shaping the data that is actually posted online. Data on the delivery of policy and public services, as opposed to plans for provision, are vitally important for many transparency and accountability open data use cases.
Applying the open definition?
Although governments are increasingly providing machine-readable copies of datasets for download, practices of making bulk downloads available (rather than only making sub-sets of data accessible through online query interfaces — a practice particularly common among statistical agencies) and of providing a clear, unambiguous license statement that permits unlimited re-use of public data, remain relatively rare. Many datasets are provided with no clear licensing information, leaving users uncertain about whether they can use the data to build businesses, and technical intermediaries unclear as to their rights to redistribute the data.
Of the 1,290 datasets surveyed for this study, just 10% were available in forms that meet the Open Definition. Only 31 countries had one or more open datasets, and even among the Barometer’s top-ranked countries, the number of open datasets provided just tops 52%5.
Transport datasets were the most likely to be provided in machine-readable formats and with open licenses. This indicates a clear recognition of the importance of licensing for data to be re-used and to support the emergence of an app economy. By contrast, contracting information, company registries, and land ownership data are the least likely to meet the open definition. Although in most cases, governments do have online systems that hold this data, these systems are frequently designed to limit public access to key information, or to only make information available for a fee. It is notable that in developing countries, these systems are often funded by donor money, providing a leverage point for donors to increase the sustainable provision of open data in the future.
The need for more timely data
A major theme identified in this year’s study, as we compared dataset assessments from 2013 and 2014, was the prevalence of datasets, which have not been updated. In many cases, datasets hosted on open data portals were from previous years; in other cases, the original source data from departments showed no signs of recent update6.
Timeliness and sustainability are particularly important factors for both accountability and entrepreneurship. Without being able to trust that data will be updated regularly, civil society and private firms are less likely to rely upon, and build tools and services on top of open datasets.
The largest problems with sustainability of publishing were seen for environmental and crime data, with just 53% and 61%, respectively, of machine-readable datasets in these categories judged to be sustainably published. In the case of environmental data, many countries appeared to lack strong environment data portals — many websites were found hosting significantly outdated data, and a number appeared to have been created with aid funding, but not sustained after that funding ended. This again illustrates a number of the challenges ahead for the data revolution: a need to embed local capacity to keep data updated, and a need to invest not just in technical platforms, but also in skill-building so that tools can be maintained and sustained, even when outside support ends.
Formats & standards
Out of the 1,090 distinct download options identified in the technical survey, 385 files were provided in XLS format, 215 in CSV format, and 84 as XML. Just 21 JSON files were identified. In general, with the exception of transportation data, (where the GTFS standard was used in 11 of the cases examined), there was very little evidence of the use of global standards to represent key datasets. Ths is due, in part, to the limited availability of reference standards to use. The absence of clear standards for representing key datasets, such as budgets, has two consequences. Firstly, it provides no standard of measurement by which adequate or good quality publication of certain kinds of data can be assessed. Secondly, it restricts interoperability and means that users of data seeking to link up data from different countries, or to transfer an application developed in one context for use in another, have to re-create and re-code their data uses country-by-country.
The Open Contracting Data Standard, launched in November 2014 is one experiment with providing both a technical interoperability standard, and a standard for assessing good contracting data publication. Work is needed in the open data field to establish and develop other standards, ensuring these are created in inclusive ways.
Dataset details
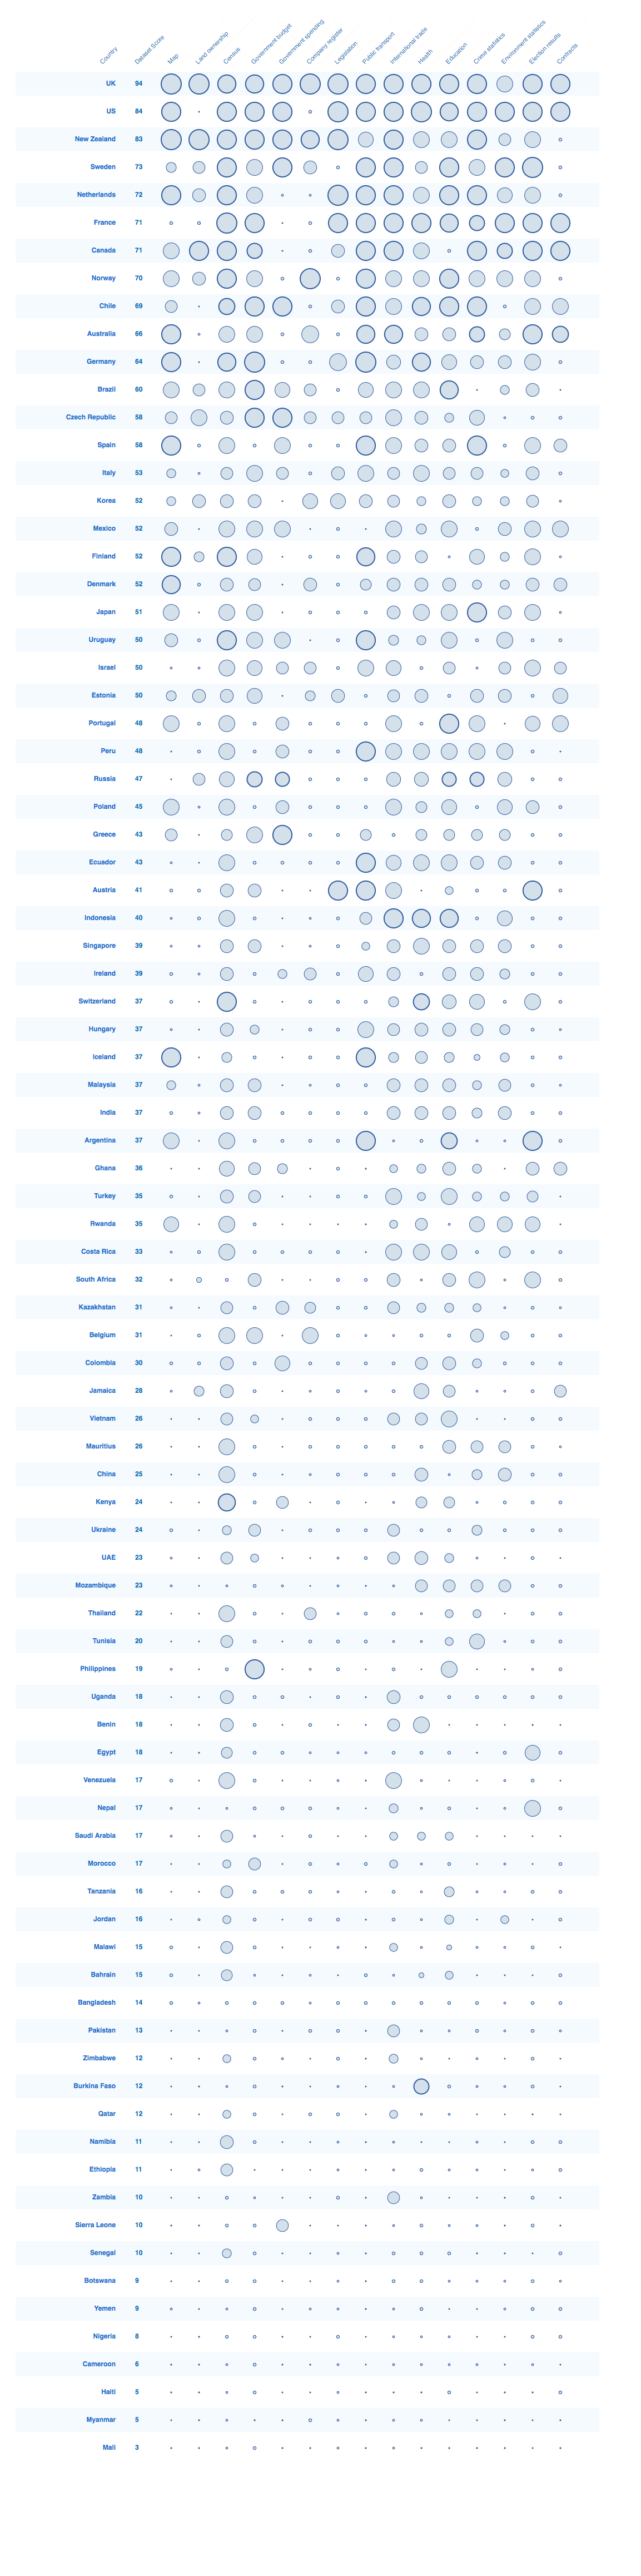
Although the overall picture of open data implementation shows that there is a long way yet to go, some countries continue to move towards ‘open by default’.
The chart below offers a full view of all the datasets assessed for this edition of the Barometer, along with a comparison to 2013. The size of each bubble is relative to the overall weighted dataset score. A thick outline indicates a dataset that meets the Open Definition criteria. It is possible to sort and search by country, or to sort by overall or dataset score by clicking a column heading.
Footnotes
-
G8. (2013). G8 Open Data Charter: Annex https://www.gov.uk/government/publications/open-data-charter/g8-open-data-charter-and-technical-annex#technical-annex ↩
-
This means that countries which had an outdated dataset in 2013, and who have made no changes to it where updates would be anticipated, will score 5 points lower this year for that dataset. Countries with an updated dataset gain +10 for the dataset being updated, leading to an overall 15 point difference between those who have timely datasets, and those who do-not. The ODB technical assessment has collected meta-data on last update dates, and data of survey, with a view to, in future, exploring the Tau of Data metric proposed by Ulrich Atz ↩
-
Based on a score of 5 or above on the expert survey question “To what extent is there a well-resourced open government data initiative in this country?”. To score 5 evidence should be provided at least that: “There is a small-scale open data initiative, or an open data initiative has been announced but is not yet resourced. Senior leadership is making commitments to increased government transparency, and/or some commitments to open data are being expressed by a junior minister / single ministry.” ↩
-
Andrews, Matthews (2013), How Transparent Are Open Budgets? http://matthewandrews.typepad.com/the_limits_of_institution/2013/10/how-transparent-are-open-budgets.html ↩
-
Based on the top 11 countries by rank (top 11, rather than top 10 used due to tied 10th place). ↩
-
Our technical survey asks for an assessment of dataset timeliness, based on how often updates would be anticipated for the particular category of data (e.g. Census data might only be updated every 10 years, whilst trade records are often updated monthly, or at least yearly). It also asks researchers to make a judgement on the sustainability of a dataset, based on evidence of whether open data appears to be a one-off publication, or whether there is evidence of regular, sustained and resourced open data publishing in a given category. ↩